About the client
London North Eastern Railway (LNER) operates high-speed intercity services along the East Coast Main Line, one of Britain's busiest and most commercially significant rail routes. The operator runs services between London King's Cross and cities including Leeds, Edinburgh, Aberdeen and Inverness, carrying millions of passengers a year across a 365-mile network.
"Quantifying, reporting, and reducing sub-threshold delays is the most effective way to improve our reliability from the current 57% to the level passengers expect and deserve."
Performance Delivery Manager, LNER
Value proposition
Background
LNER's on-time performance stands at approximately 57%, meaning 43% of services arrive late. Of these delays, only around 3–4% can be attributed to known causes through formal delay attribution, leaving roughly 40% of delay minutes unexplained.
These unexplained delays are classified as sub-threshold: typically under three minutes, they fall below the threshold for formal reporting. While individually small, they accumulate across services and sections of the network, producing a compounding impact on overall punctuality.
Conventional performance monitoring captures station arrival and departure times, but provides limited insight into how trains perform between stops, where many delays originate. Variations in sectional running time remained difficult to detect consistently, leaving operations teams without the data needed to understand or address root causes.
Approach
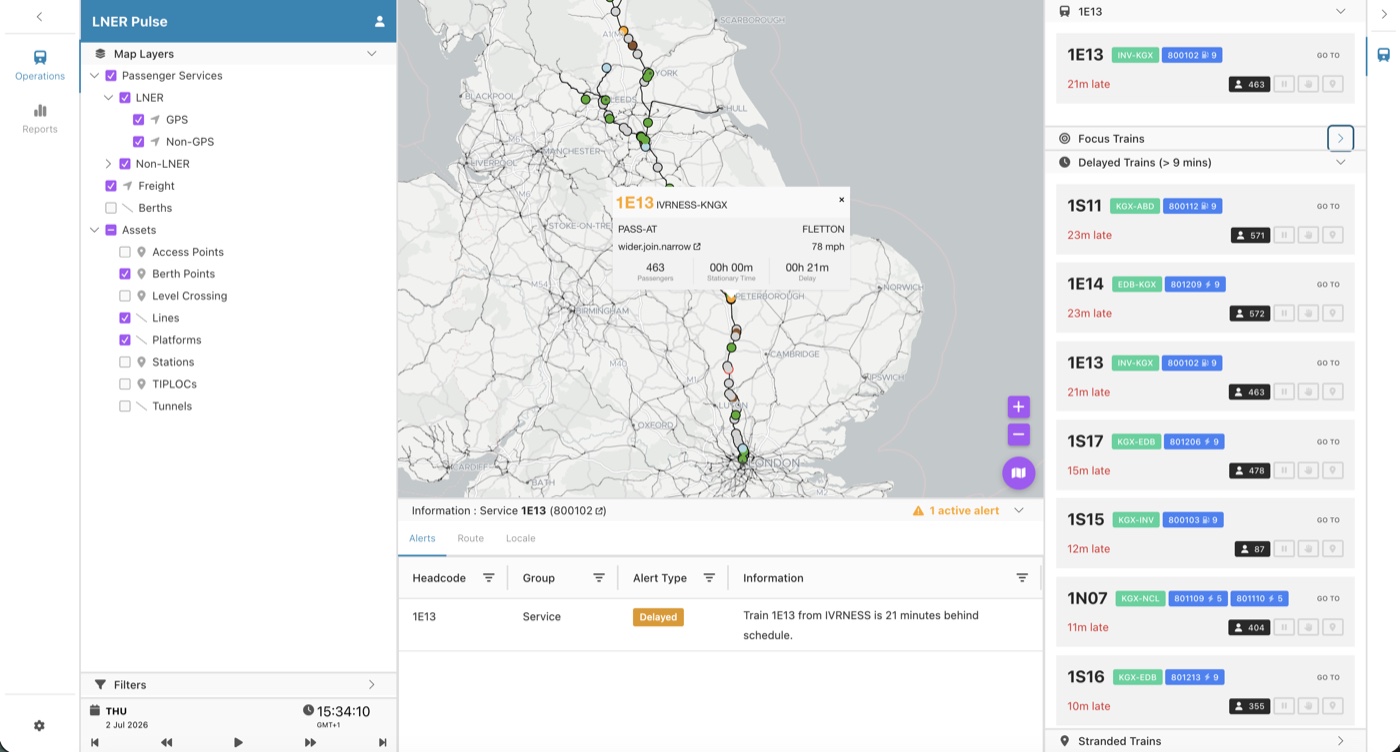
LNER collaborated with Emu Analytics, a finalist in the LNER Future Labs 3.0 accelerator programme, to develop Pulse: a real-time rail performance system built on Flo.w.
Pulse combines multiple operational datasets into a single, live view of train movements at a level of granularity not previously available. A central innovation was the construction of a route topology using complex spatial algorithms to geolocate signalling berths and align them with GPS and infrastructure data, making it possible to analyse train performance at track level, section by section, in real time.
Capabilities
Pulse ingests and aligns multiple live data sources to build a single, coherent picture of train movements across the route.
A bespoke route data model represents the East Coast Main Line as a topological network, enabling reliable analysis at track level across the full 365-mile route.
LNER's operations teams gained a single live view of all train positions and performance across the network, enabling faster identification of emerging delays and better coordination between teams.
Beyond the real-time view, Pulse provides analysts with the tools to examine trends in sectional running times, identify recurring delay locations, and uncover operational inefficiencies hidden within aggregated statistics.
Book a 30-minute demo and we'll show you exactly what Flo.w looks like in your environment, with your data.